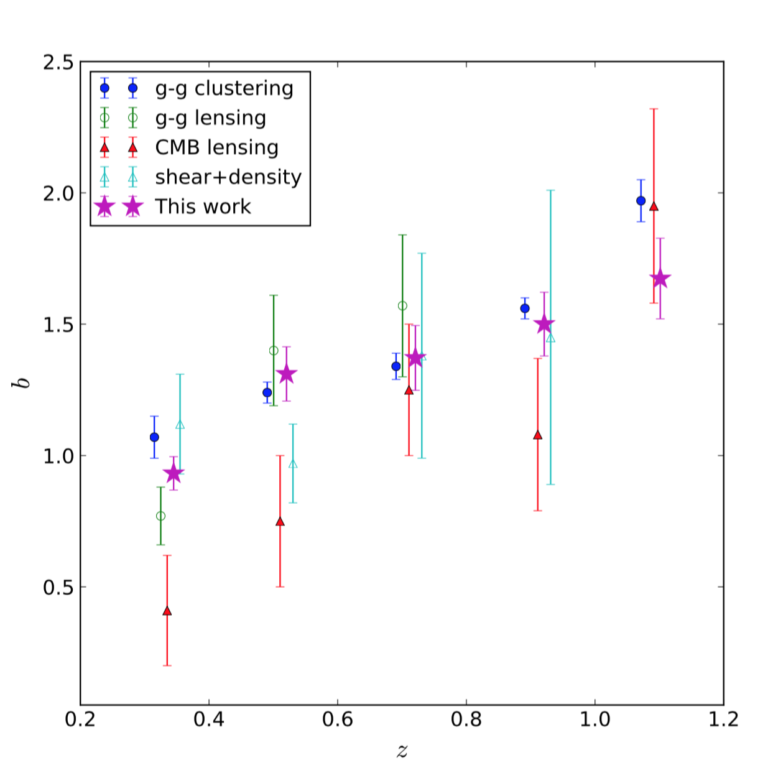
Measuring Linear and Non-linear Galaxy Bias Using Counts-in-Cells in the Dark Energy Survey Science Verification Data
Authors: A. I. Salvador, F. J. Sánchez, A. Pagul et al. Journal: …
Arnau Pujol’s publications
Authors: A. I. Salvador, F. J. Sánchez, A. Pagul et al. Journal: …
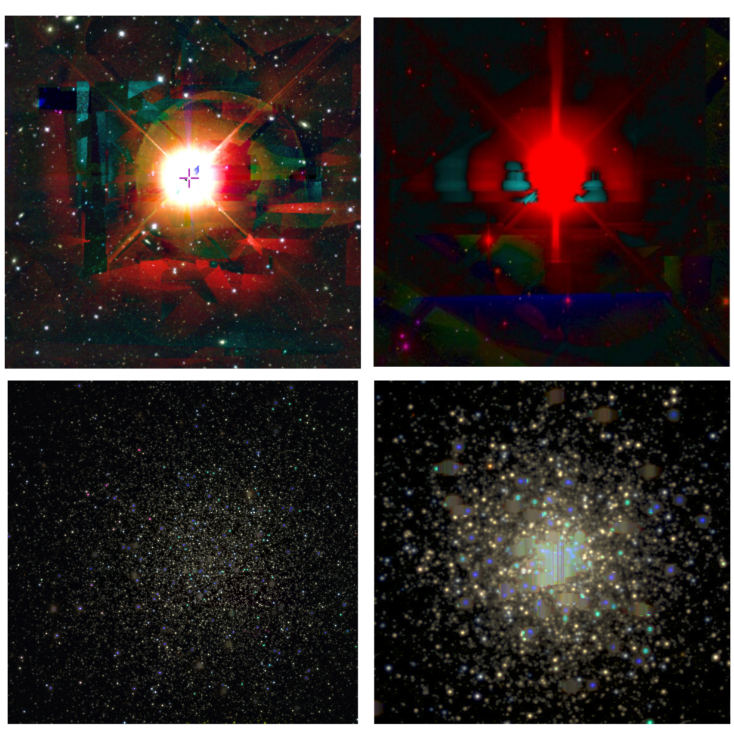
Authors: A. Pujol, M. Kilbinger, F. Sureau & J. Bobin Journal: Year:…
Authors: DES Collaboration Journal: Year: 01/2018 Download: ADS| Arxiv Abstract We describe…
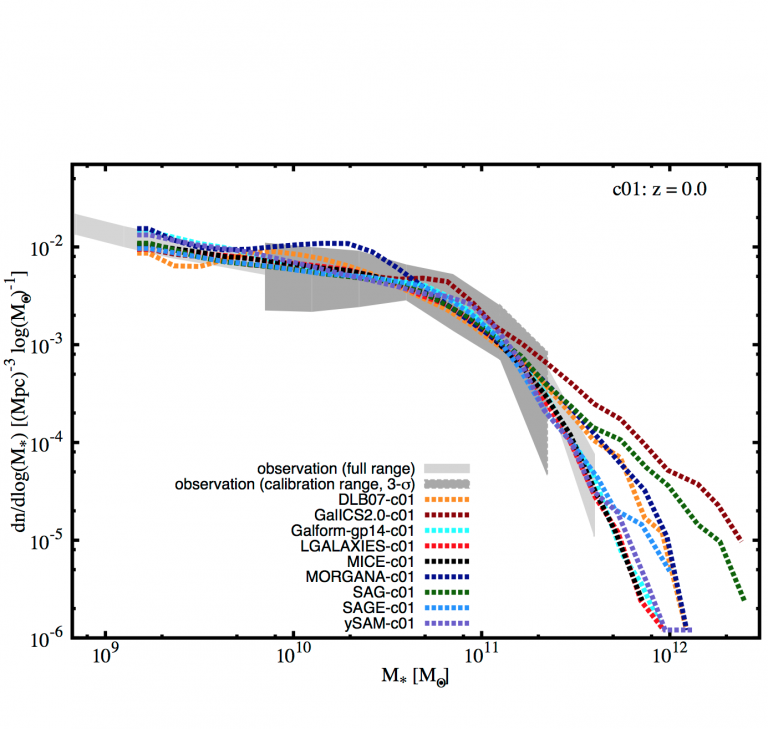
Authors: A. Knebe, F. R. Pearce, V. Gonzalez-Perez et al. Journal: Year:…
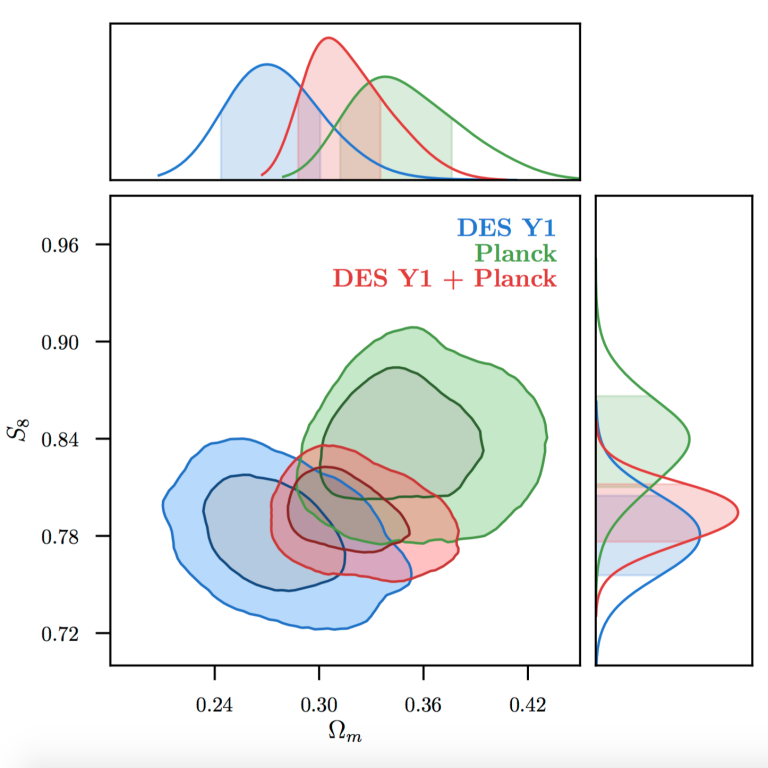
Authors: DES Collaboration Journal: Year: 08/2017 Download: ADS| Arxiv Abstract We present…
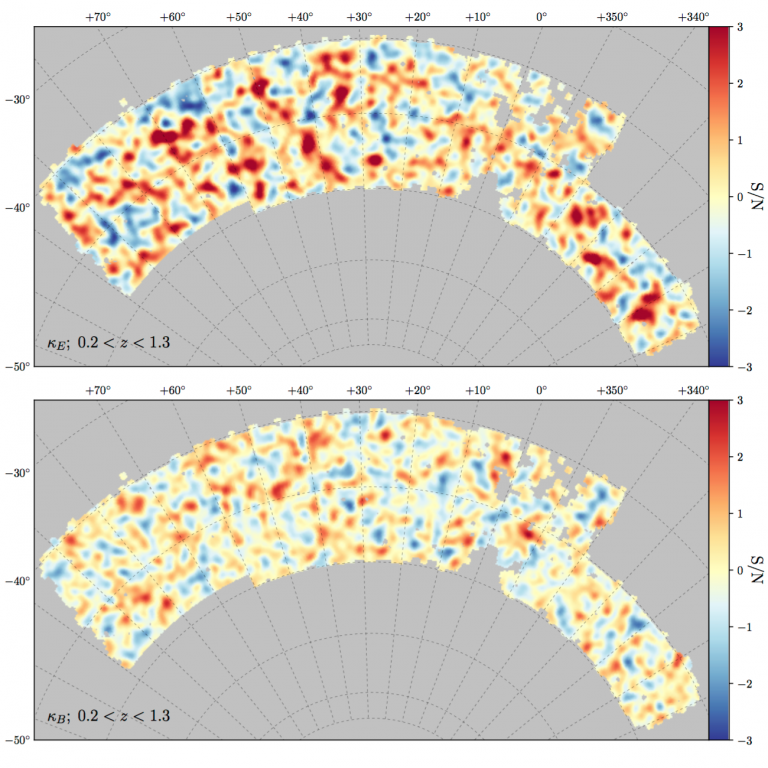
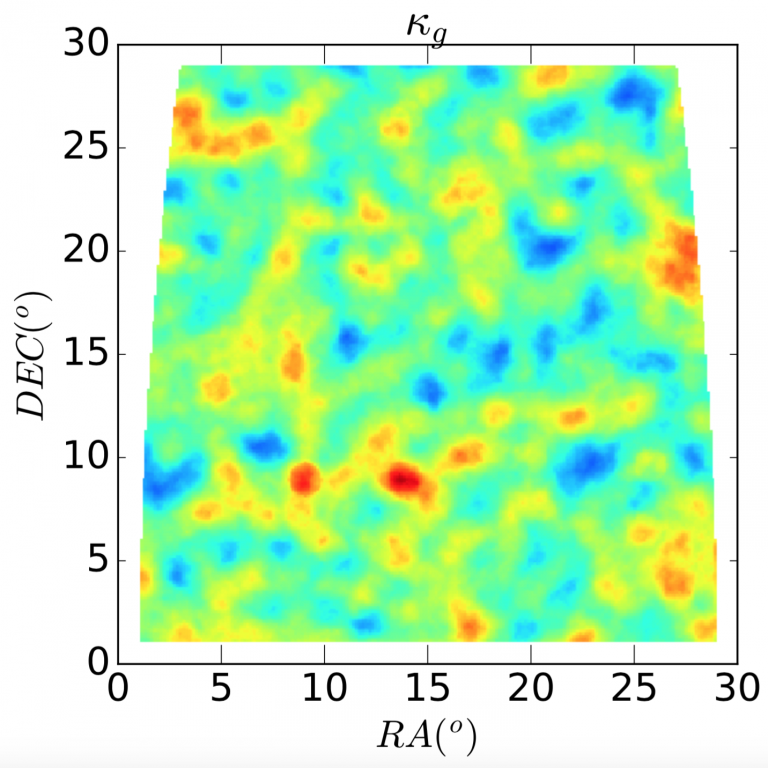
Authors: C. Chang, A. Pujol, B. Mawdsley et al. Journal: Year: 08/2017 Download:…
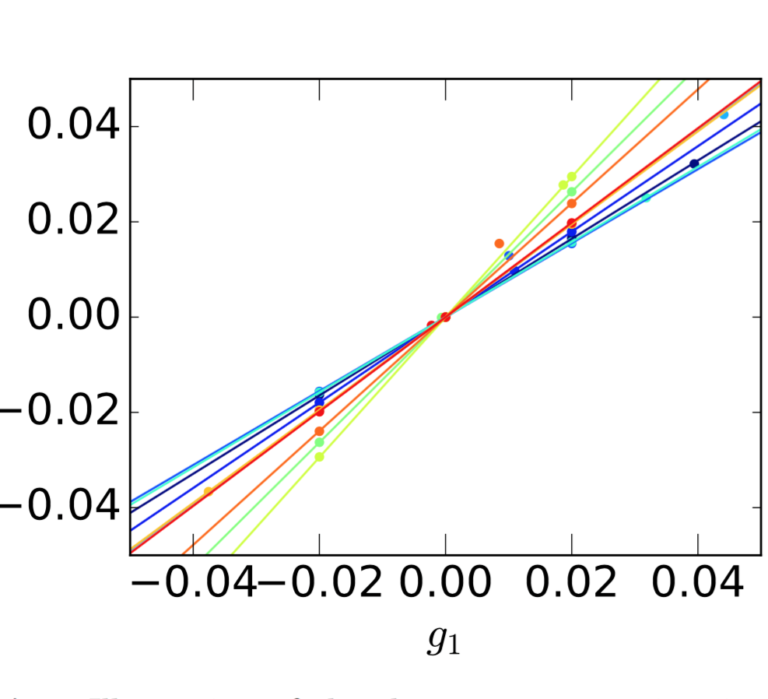
Authors: A. Pujol, F. Sureau, J. Bobin et al. Journal: A&A Year: 06/2017 Download:…
Authors: A. Pujol, R. A. Skibba, E. Gaztañaga et al. Journal: MNRAS Year: 02/2017…
Authors: A. Pujol, K. Hoffmann, N. Jiménez et al. Journal: A&A Year: 02/2017 Download:…
Authors: A. Pujol, C. Chang, E. Gaztañaga et al. Journal: MNRAS Year: 10/2016 Download:…